감염 시뮬레이션 - pygame
개요
감염 시뮬레이션 기본편 processing 코드를 pygame으로 다시 작성
pygame은 vsc에서 구동 가능하여 여러 라이브러리들을 같이 쓸 수 있음
솔직히 processing은 필수적인 라이브러리가 안돼서 불편했다
특히 numpy가 안됐던 것이 너무나도 불편해서 그냥 앞으로 쭉 pygame 쓰는게 낫겠다고 생각함
특히 그래프 그릴 때 matplotlib랑 같이 쓸 수 있어서 더 정확한 그래프 그리기가 가능함
결과
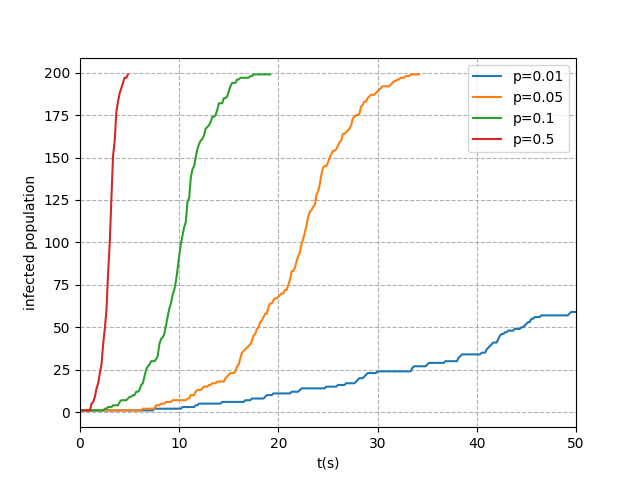
matplotlib로 작성한 결과그래프는 다음과 같다.
감염률 다르게 총 네 번 시행하였고
전체적인 그래프의 모양은 동일하지만 감염률에 따라 그래프 폭이 달라진다는 것을 확인할 수 있다.
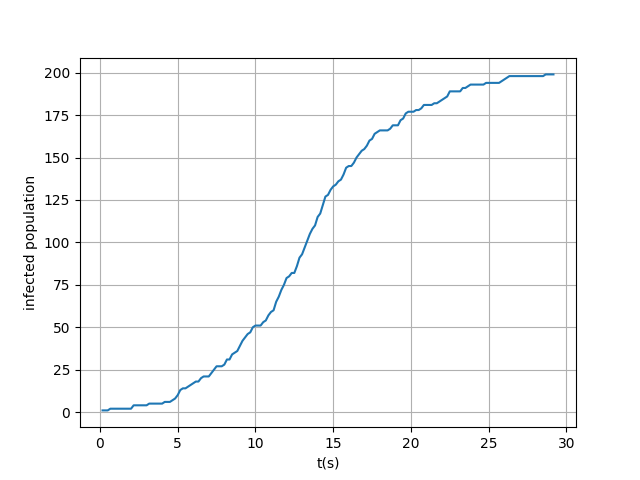
-> p = 0.05로 한번 시행했을 때의 그래프
소스코드
import time
import pygame as pg
from math import dist
from random import *
import numpy as np
from infection_graph import graph

c_size_x = 600
c_size_y = 600

def timeshow():
    return time.time()

pg.init()
screen = pg.display.set_mode([c_size_x,c_size_y])
title = 'infection_simulation'
pg.display.set_caption(title)

clock = pg.time.Clock()

SB = 0 # 상태함수, 0이 되면 프로그램 종료

'- <CLASS> -------------------------------------------------------------------------------------'

class people(object):
    def __init__(self, r, age, sex, xp, yp, st):
        self.age = age
        self.sex = sex
        self.p = np.array([xp, yp])
        speed = 10 - self.age/50
        self.velocity = np.array([uniform(-speed, speed),uniform(-speed, speed)])
        self.viv = 5 - 0.15*self.age
        self.st = st # 0 = 건강, 1 = 감염, 2 = 사망
        self.r = r


    def show(self):
        if self.st == 0:
            self.c = [100,220,100]
        else:
            self.c = [255,0,0]
        pg.draw.rect(screen, self.c, [self.p[0]-self.r/2, self.p[1]-self.r/2, self.r, self.r])


    def move(self):
        self.p += self.velocity
        if self.p[0] >= c_size_x-self.r/2 or self.p[0] <= self.r/2:
            self.velocity[0] = -self.velocity[0]

        if self.p[1] >= c_size_y-self.r/2 or self.p[1] <= self.r/2:
            self.velocity[1] = -self.velocity[1]


    def aging(self):
        self.age += 0.01

    def infect(self):
        for a in ppl[ppl.index(self)+1:]:
            if dist([self.p[0], self.p[1]], [a.p[0], a.p[1]]) < r and uniform(0,1) < 0.05: # 감염확률
                if self.st == 1 and a.st == 0:
                    a.st = 1
                    ppl_inf.append(a)
                elif self.st == 0 and a.st == 1:
                    self.st= 1
                    ppl_inf.append(self)


'- <FUNCTION> --------------------------------------------------------------------------------------'

def show():
    for people in ppl:
        people.aging()
        people.show()
        people.move()
        people.infect()


'- <INITIATION> --------------------------------------------------------------------------------------'

number = 200
r = 8
age_lim = 50
age_lim_infected = 50
start_time = timeshow()
frame = 0
data = list()

ppl = []
ppl_inf = []
death = []
time_rate = []
for i in range(number):
    ppl.append(people(r, randint(0,age_lim), choice([0,1]), uniform(r/2, c_size_x-r/2), uniform(r/2, c_size_y-r/2), 0))

ppl[0].st = 1
ppl_inf.append(ppl[0])
ppl[0].age = 0

'- <RUN> ---------------------------------------------------------------------------------------------'

while SB == 0:

    clock.tick(60) # fps 설정
    passed_time = timeshow() - start_time

    screen.fill([240,240,240])
    for event in pg.event.get(): # User did something
        if event.type == pg.QUIT:
            SB = 1
        elif event.type == pg.MOUSEBUTTONDOWN:
            print(data)

    frame += 1

    if frame % 10 == 0:
        data.append([frame, len(ppl_inf), len(ppl)])

    if frame == 100:
        print(len(ppl_inf))
        SB = 1


    show()

    pg.display.flip()
확실히 정교한 그래프가 도출된다.
seaborn만큼의 성능은 아니지만 matplotlib도 많이 쓰도록 하자